Open the app and pick a slate
Head to the simulator, sign in, and pick your slate (Classic or Showdown) in the top bar. ① Generate and ② Simulate are the two phases of every run; the tabs below (Projections → Pool → Lineups → Exposures) follow in the order you'll use them.
Already entered contests on DraftKings? Download your entries file from draftkings.com/entry/upload and upload it with 📋 Upload entries. SimSlate fills it with your lineups at the end (step 9).
Review the projections
The app opens on the Projections tab: every player on the slate with salary, projection, projected ownership, optimal rate, and points per $1k.
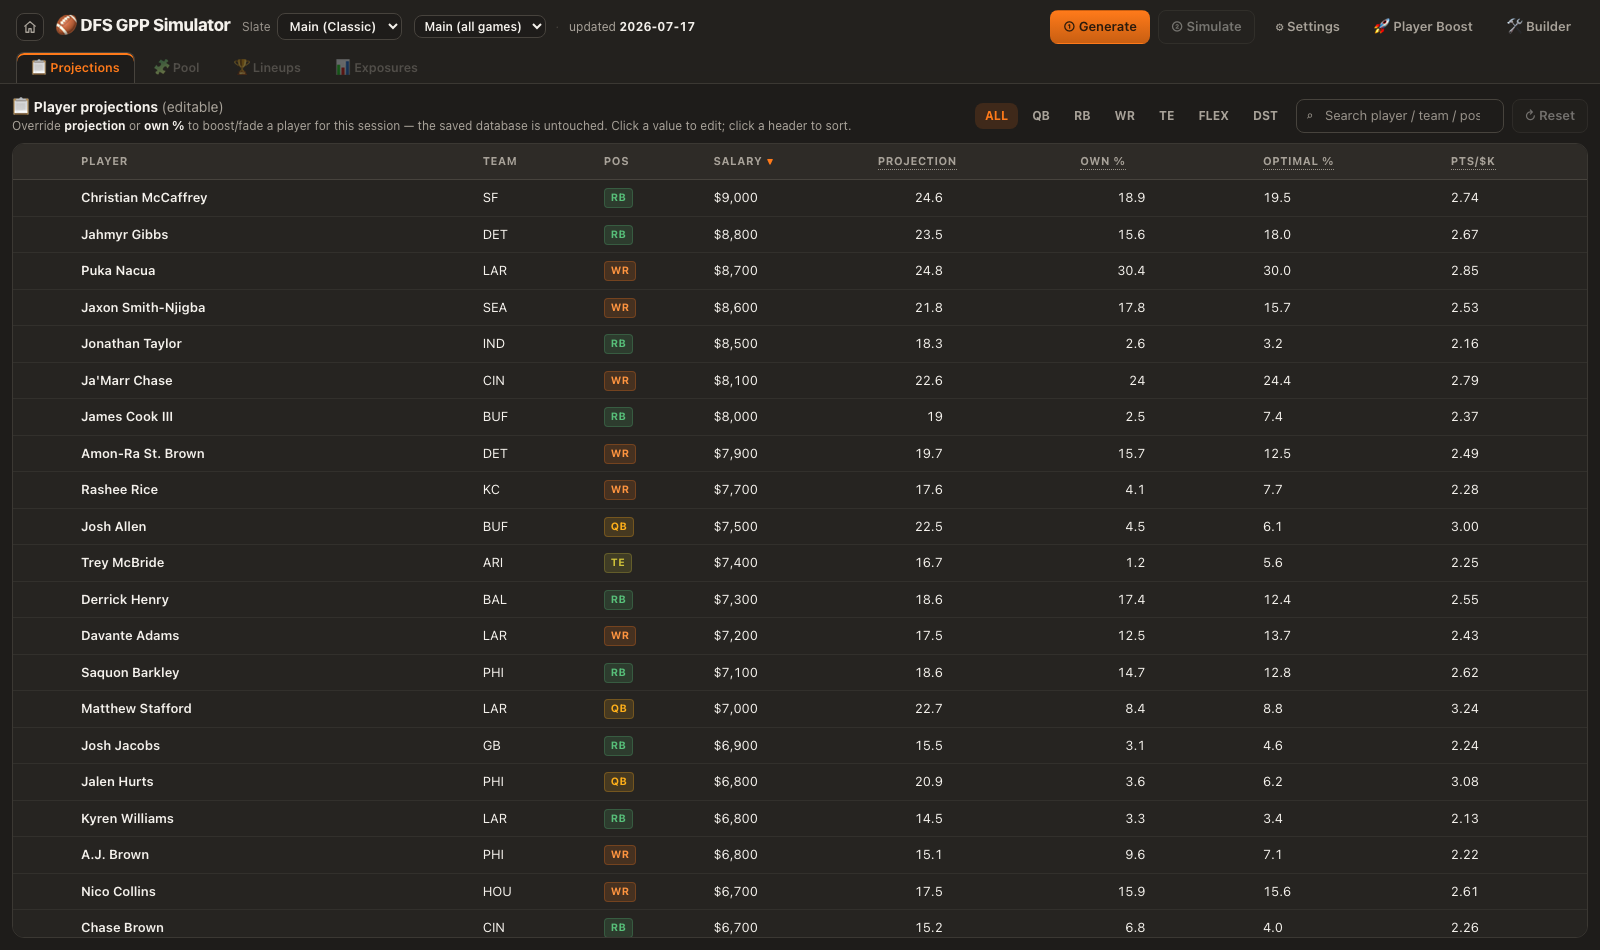
The Projections tab: the session starts here, and every number is editable.
Both projection and own % are editable: click a value and type yours. The engine refits that player's distribution around your projection, and your ownership becomes the field-building target. Overrides last only this session; ↺ Reset puts everything back.
You don't have to touch anything here. The defaults are a full, coherent slate; editing is only for pressing a personal read.
Check your settings
The ⚙ Settings popover controls the contest you're simulating and how hard the engine works:
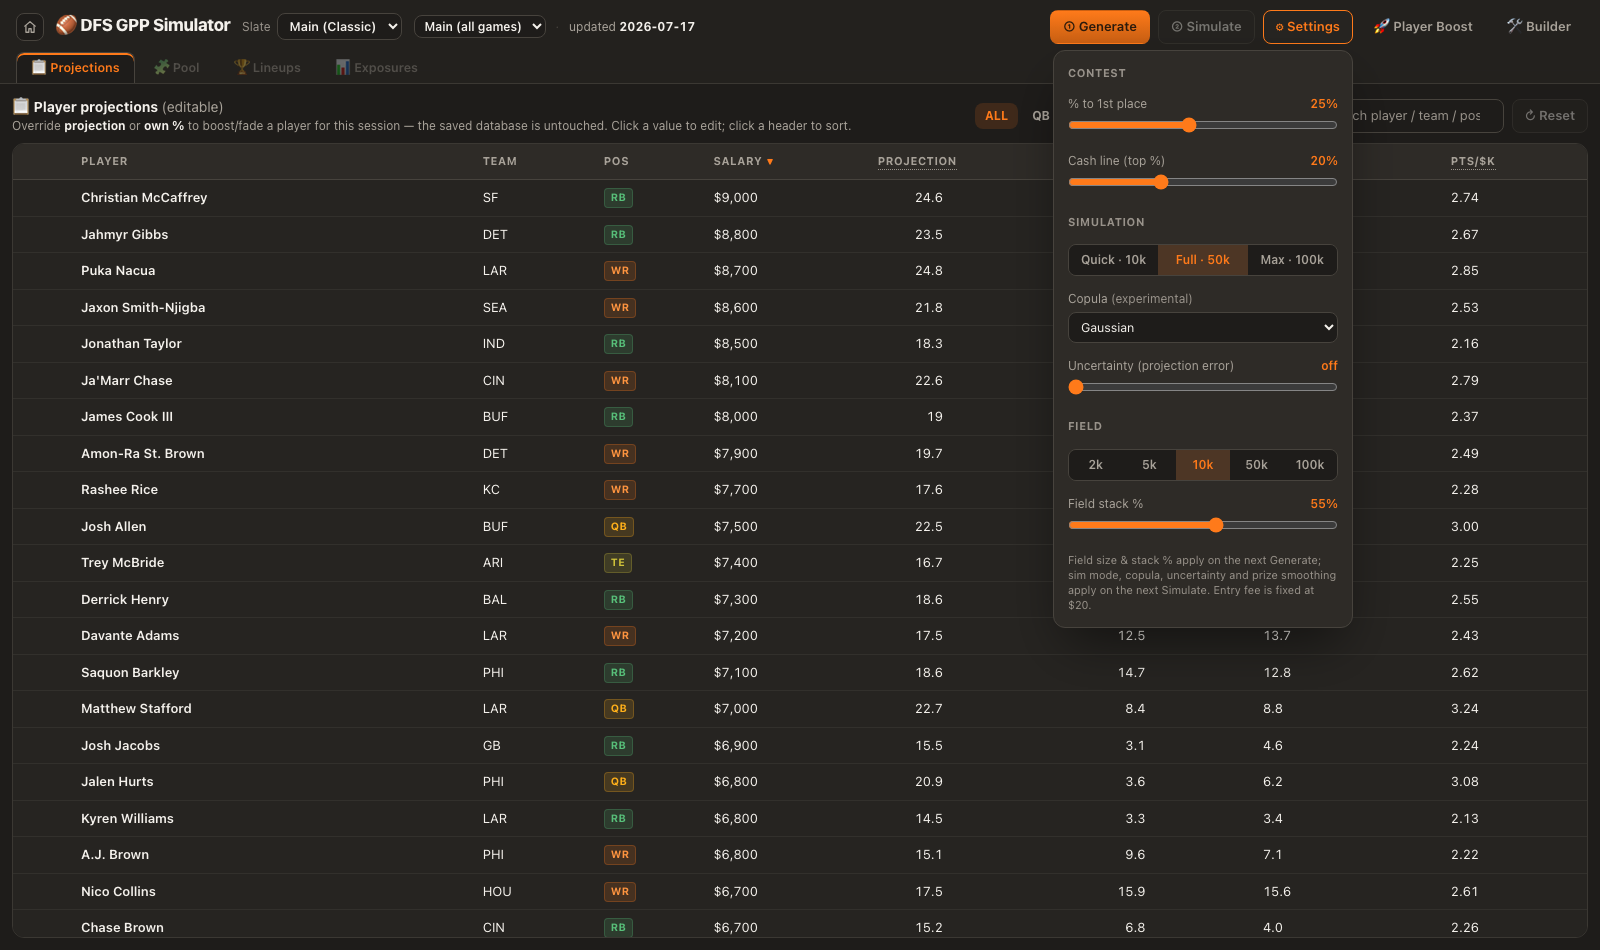
Settings: contest shape on top, simulation depth in the middle, field size at the bottom.
- % TO 1ST / CASH LINE
- The payout curve's shape: how top-heavy the tournament is and what share of entries cash. Match these to the real contest you're entering.
- SIMULATION
- Quick (10k sims) while you iterate, Full (50k) for real runs, Max (100k) when you want the deepest read.
- FIELD
- How many opponent lineups to build. 10k is the standard; go bigger to model large-field GPPs.
- FIELD STACK %
- How much of the field stacks QBs with pass catchers, i.e. how sophisticated your opponents are.
Field size and stack % apply on the next Generate; sim mode and uncertainty apply on the next Simulate, so you can re-simulate the same field at different depths without rebuilding it.
Generate the field
Click ① Generate. The engine builds thousands of opponent lineups, with every player's exposure held to a tight band around their projected ownership.
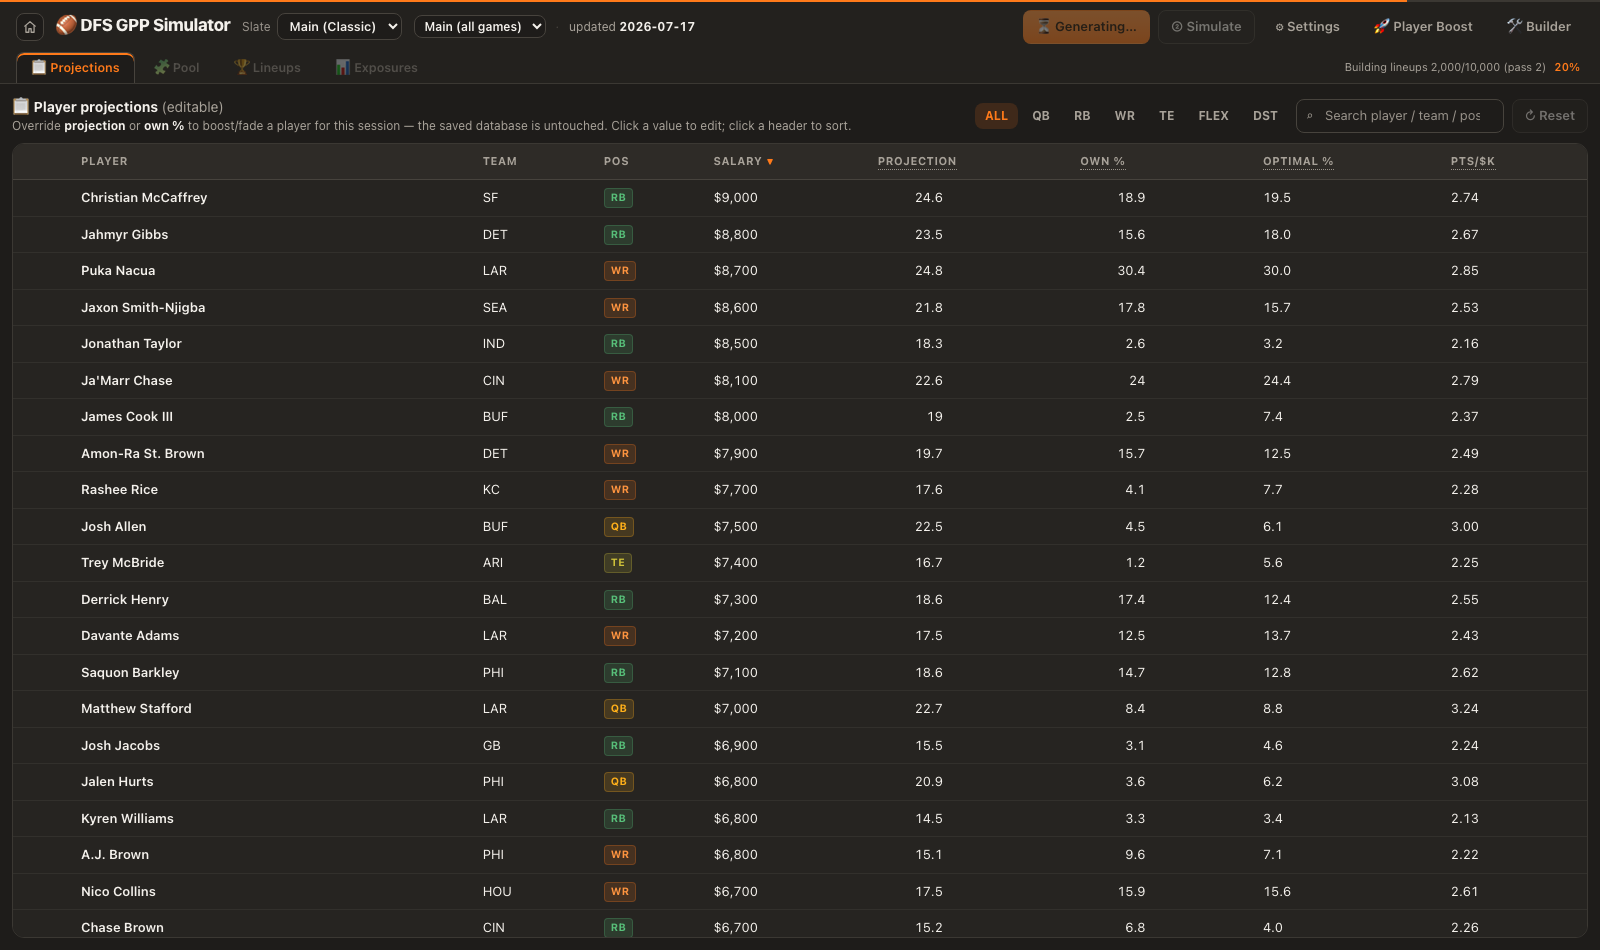
Generating... the progress readout sits in the top-right corner.
When it finishes, the app switches to the Pool tab: each player's projected ownership, actual ownership in the generated field, and the difference: proof the field you're about to sim against matches the ownership projections.
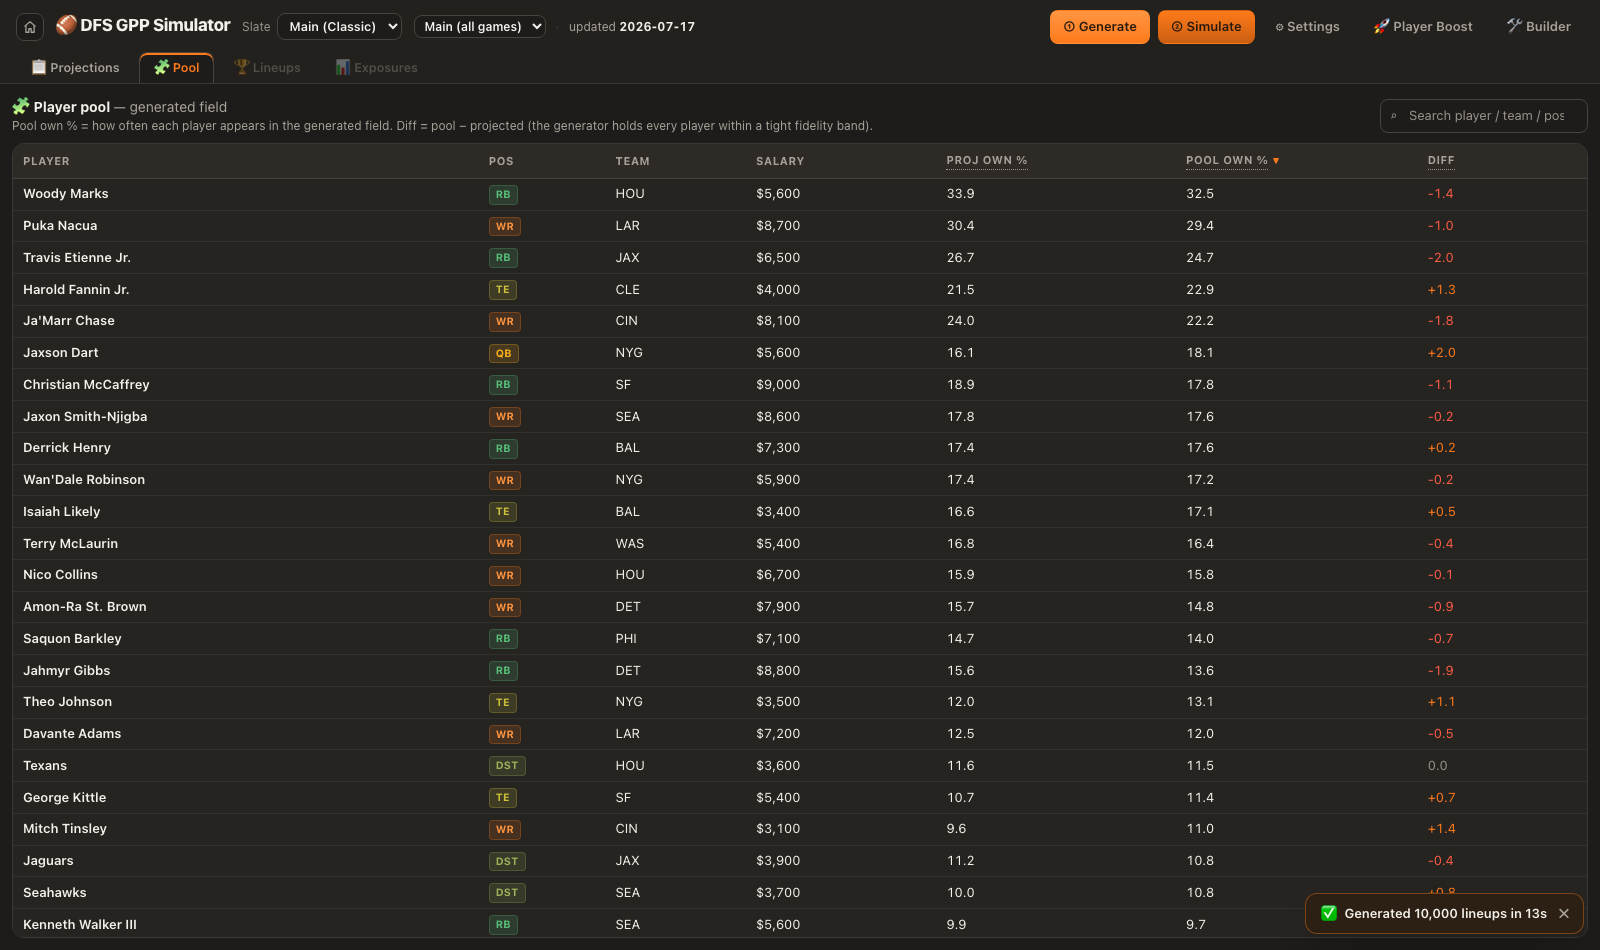
The Pool tab: projected vs generated ownership, per player. Diffs stay small by construction.
Simulate the contest
Click ② Simulate. The engine plays out the slate tens of thousands of times (players drawn from skewed, correlated distributions so stacks spike together), scoring the whole field each time and paying the contest's actual prize curve, with duplicate lineups splitting prizes.
When it's done, the Lineups tab opens with the lineups sorted by highest ROI.
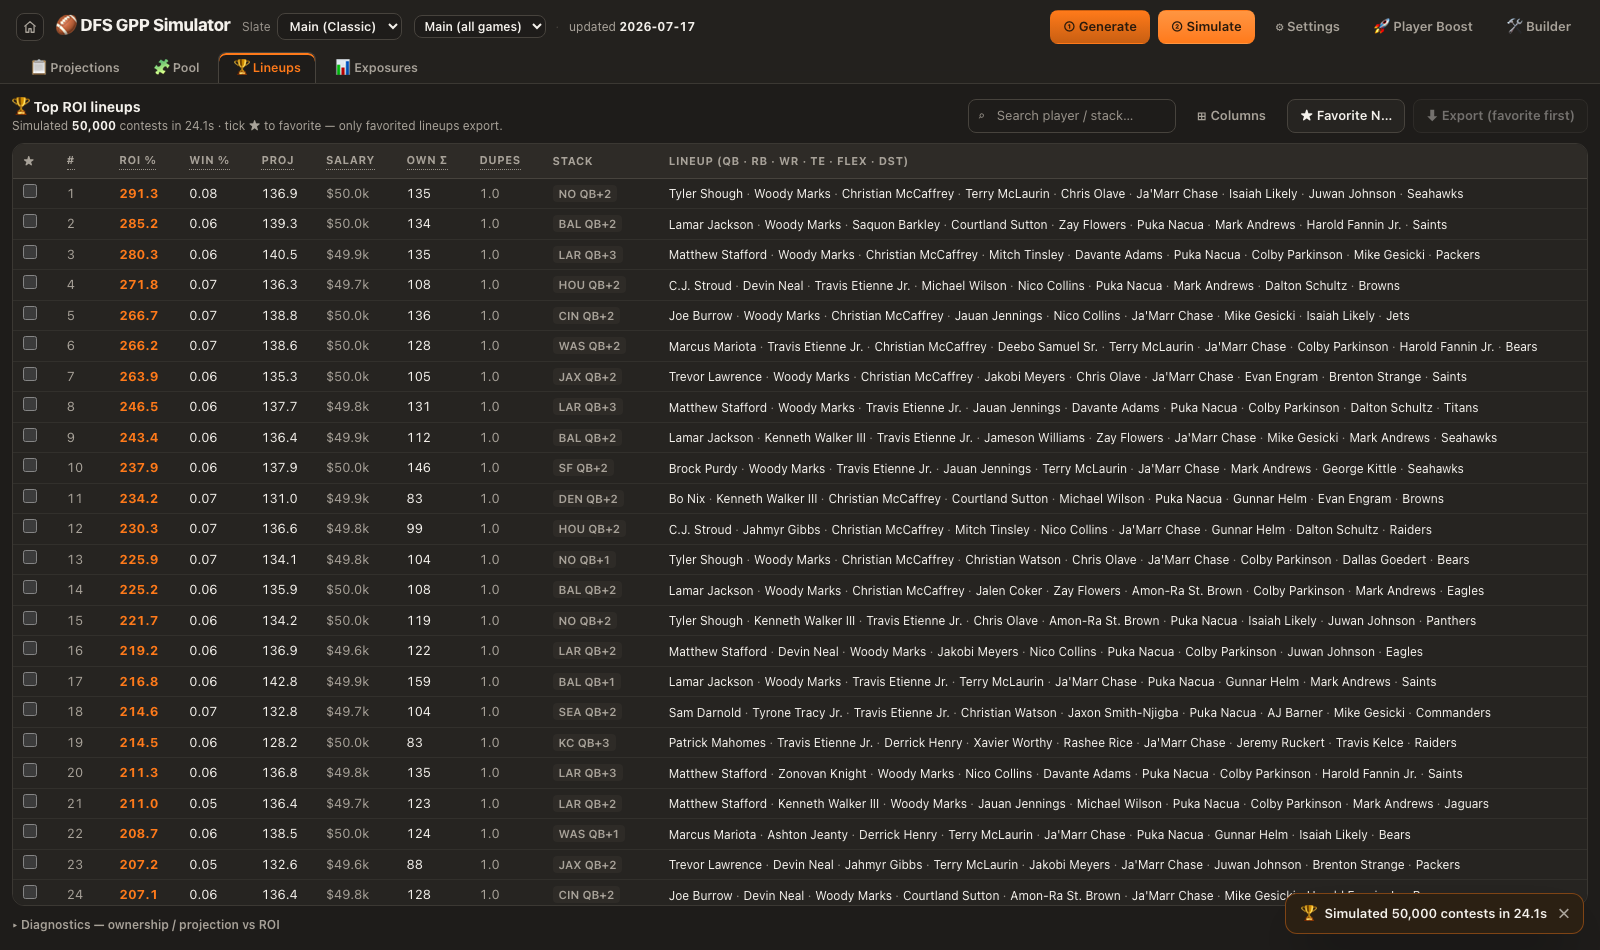
Top ROI lineups after 50,000 simulated contests.
- ROI %
- Average return on the $20 entry across every simulated contest: the ranking stat, already accounting for ownership and duplication.
- WIN %
- How often the lineup takes first place outright.
- OWN Σ
- Total projected ownership of the nine players, a quick chalk-vs-contrarian gauge.
- DUPES
- Expected copies of this exact lineup in the field. Duplicated lineups split their prizes. That's why chalk builds sink even when they score well.
- STACK
- The lineup's construction; e.g. HOU QB+2 is a Texans quarterback with two of his own pass catchers.
Boost players and set exposure caps
The board ranks lineups by ROI. 🚀 Player Boost is where you overlay your own convictions without re-running anything.
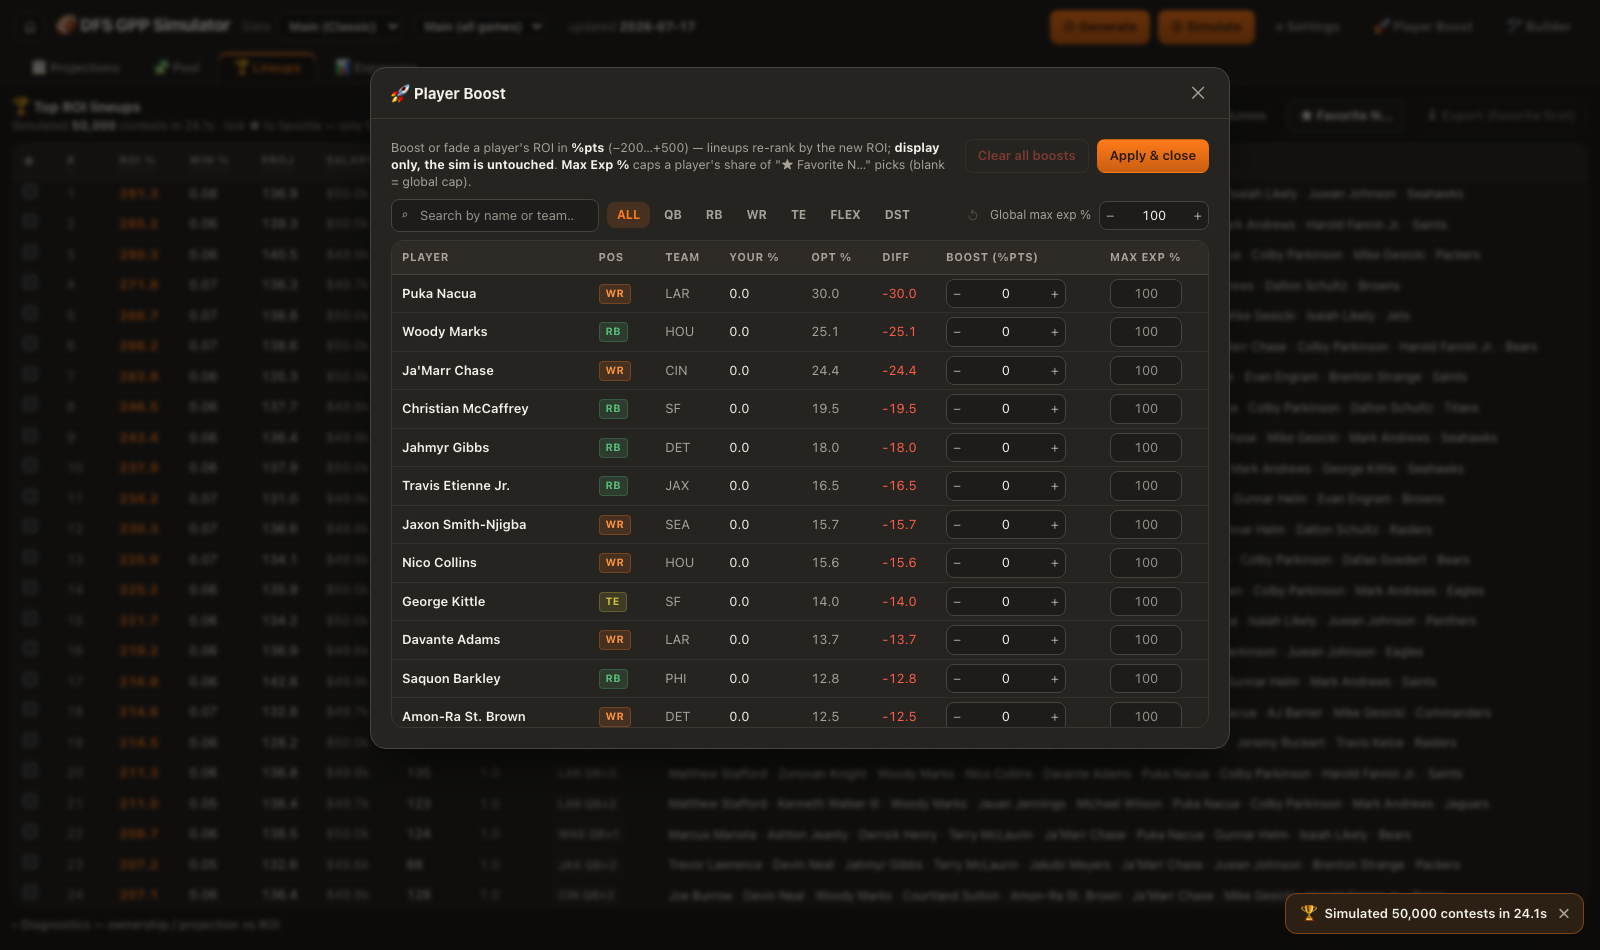
Player Boost: a +25 boost on one player, a −15 fade on another, a 40% cap on a chalk RB, and a 60% global cap.
- Boost (%pts) adds or subtracts ROI points from every lineup with that player and re-ranks instantly. Display-only; Clear all boosts restores the pure board.
- Max Exp % caps a player's share of your favorited lineups. The global cap applies to everyone; a per-player value overrides it.
Hit Apply & close and the board re-ranks with a boosted ranking badge so you always know when you're looking at an adjusted view.
Favorite the lineups you want to play
Only favorited lineups export. Two ways to build the set:
- Hand-pick: tick the ★ checkbox on any row. Hand-picks are never dropped and export first, in click order.
- Bulk: ★ Favorite N… favorites your top N
lineups by ROI (e.g. your top 20).
* Respects your exposure caps: rows that would push a capped player over their share are skipped.
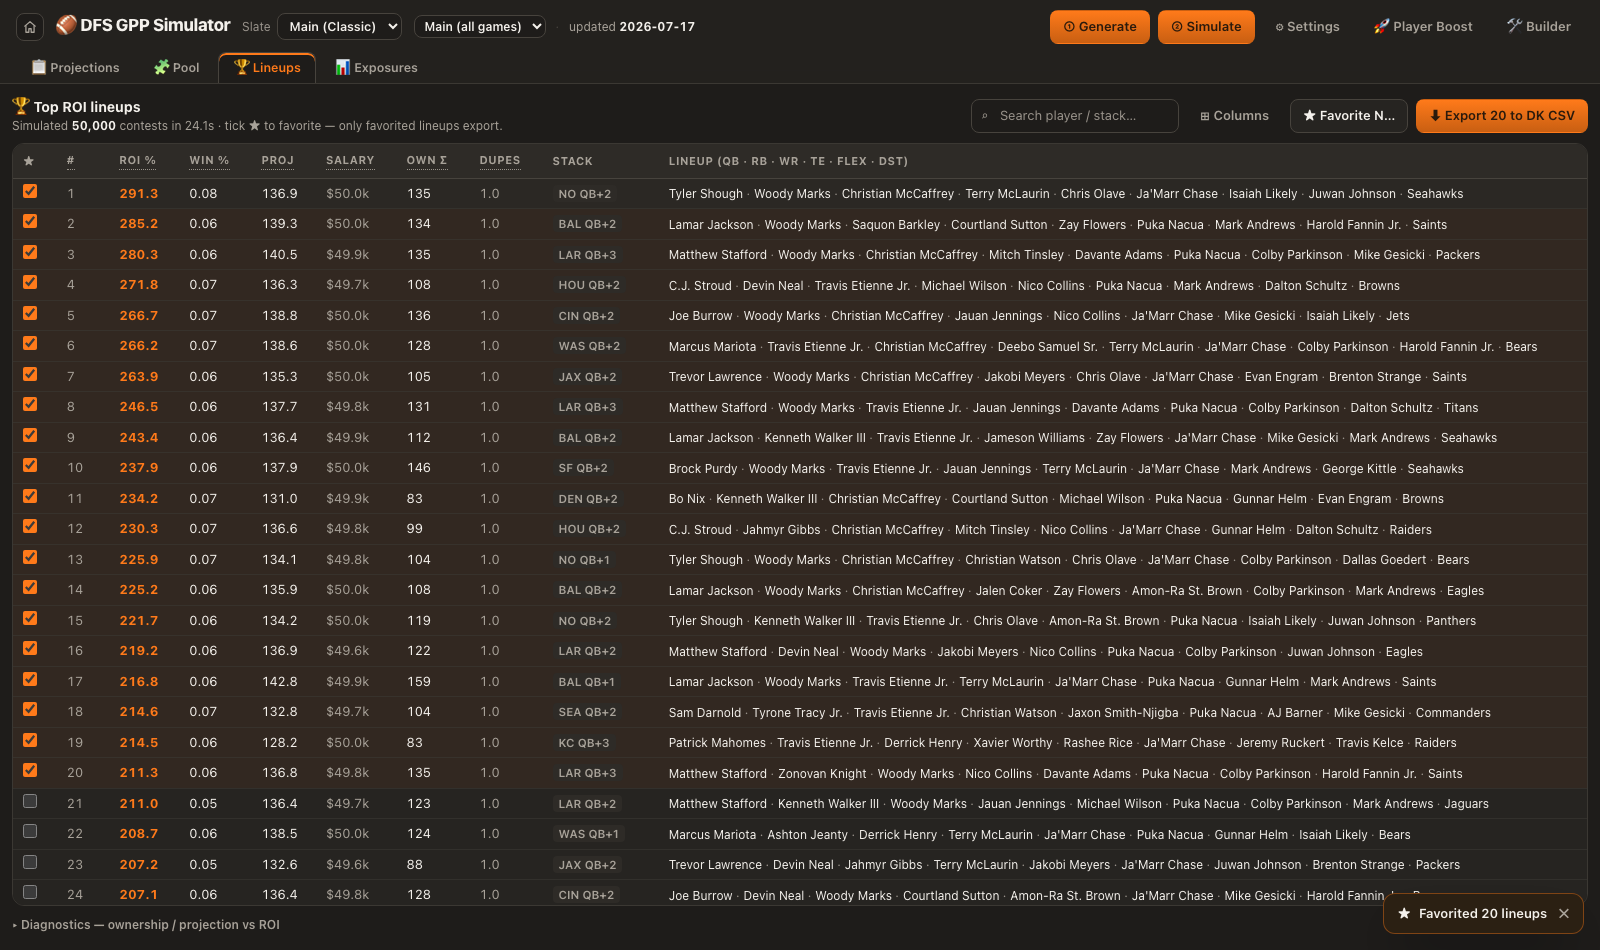
Favorite 20 with caps active. Note the skipped rows where the capped RB would have exceeded 40% of the set.
You can re-open Player Boost after favoriting: change a boost or a cap and Apply re-selects the same count under the new rules, keeping your hand-picks.
Review your exposures
The Exposures tab turns your favorited lineups into a portfolio summary: how much of each player you actually hold, and how that compares to the field.
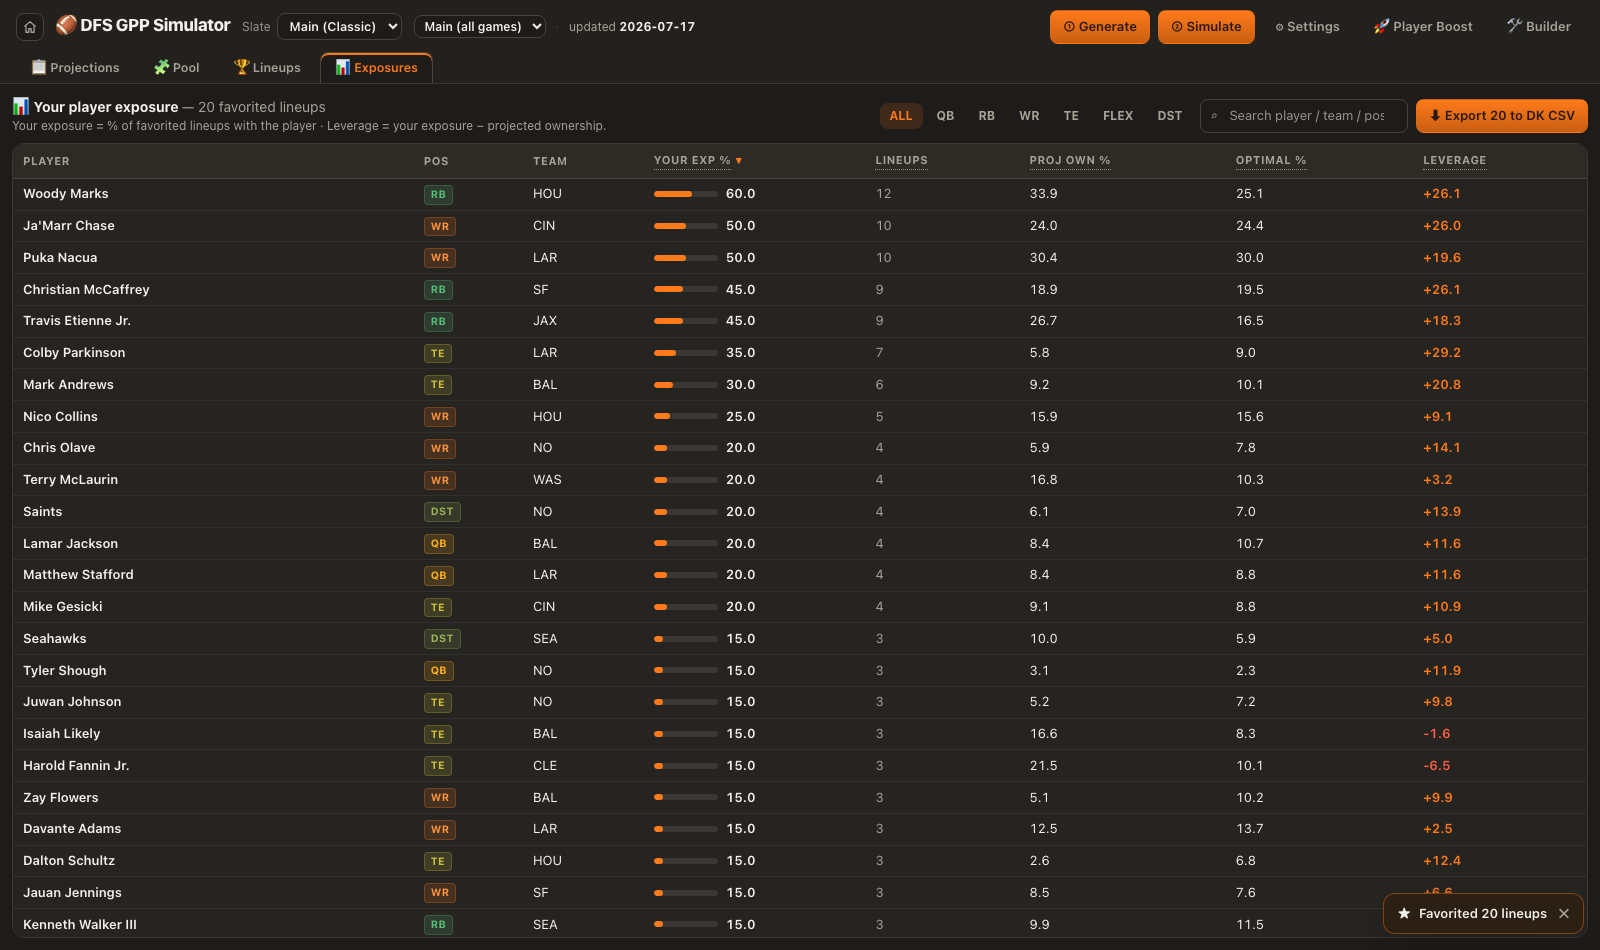
Exposures for a 20-lineup set: every capped player sits at or under their cap.
Leverage is the column to read: your exposure minus the field's projected ownership. Positive on players the sim likes, negative on the chalk you're fading: the shape of a GPP portfolio. If something looks wrong, adjust caps or boosts and re-favorite.
Export to DraftKings
⬇ Export N to DK CSV (on the Lineups and Exposures tabs) downloads your favorites as a DraftKings-formatted CSV (ex. 20 lineups). Hand-picks lead the file in click order.
If you uploaded your entries file earlier, just click 📋 Update entries instead. You get the file back with your lineups filled in, ready to upload at draftkings.com/entry/upload.
Weekly rhythm: once you've done this loop once, a slate takes minutes: open, spot-check projections, Generate, Simulate, cap the chalk, Favorite N, export. The engine does the heavy thinking between clicks.
Where to go next
- Showdown: flip the slate dropdown to a single-game Captain Mode contest. Same loop, with captain-vs-flex ownership and exposures tracked separately.
- The Lineup Builder: hand-build a lineup, sim it against the field, and get a coaching critique of its structure, dupes, and leverage.
- Methodology: the statistics behind every number you just used: distributions, correlations, duplication, and the invariants the engine must pass.
- The Edge: why ranking by ROI beats optimizing for projection.